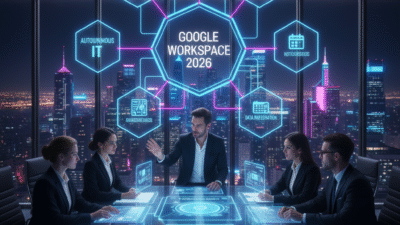
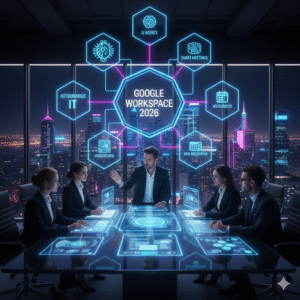
Google Workspace is the core tool for modern work. Therefore, any change to it affects millions of people. As we look to 2026, the roadmap is very clear. It is driven by artificial intelligence (AI). Truly, AI is no longer just an extra feature. Instead, it is becoming the very foundation of Docs, Gmail, Meet, and Chat. This means work will feel easier and smarter than ever before.
Many people think the biggest changes have already happened. However, the move toward deep AI integration is just starting. In 2026, the focus will shift. It moves from simple AI helpers to AI agents. These agents will work alongside your team. They will understand your company’s data. They will also manage tasks and projects for you. Always remember, the goal is to make the digital workplace a “living system”. This system connects data, context, and experience. By preparing for this next wave, your team can gain a huge advantage.
Pillar 1: AI Evolves from Co-Pilot to Co-Worker (Agents)
First, the most powerful change coming is the evolution of AI. AI is moving past simple tools like “Help me write” in Gmail. Instead, it is turning into specialized role-based agents. These agents are like smart, dedicated digital co-workers. Clearly, this is the next phase of productivity. Therefore, organizations must learn how to manage these agents.
From Simple Assistants to Specialized AI Agents
Google’s Gemini AI is now built into all Workspace subscriptions. This means everyone has access. However, in 2026, these tools will become much more specific.
Here is what to expect from these new AI agents:
-
Domain-Specific Outcomes: Agents will be trained only on your company’s data. Therefore, they will handle tasks specific to your industry or job.
-
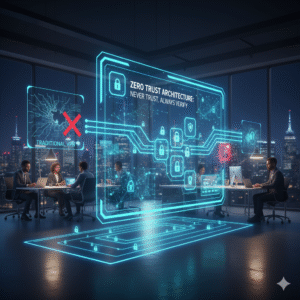
Traceable and Compliant: Organizations must manage the lifecycle of these agents. This is like managing any other digital asset. You must ensure every AI is traceable and follows company rules.
-
Context Engineering: How you set up the information around the AI will be key. You must manage the entire context, not just the text you type into the AI.
-
Citizen Developers: Employees will be able to build their own AI agents. These will handle simple, repetitive tasks. This must be done with guardrails and oversight.
Truly, the shift from a general AI helper to a specialized AI agent will redefine how tasks are done. It requires a new focus on AI governance.
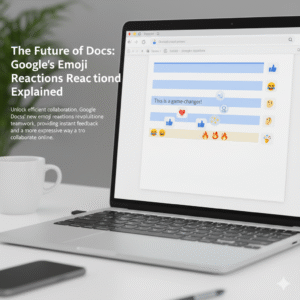
Pillar 2: Collaboration Blurs the Lines in Docs and Chat
Collaboration will also undergo a major redesign in 2026. The boundaries between communication, automation, and knowledge sharing will completely blur. Clearly, co-creation will move beyond simple real-time editing in Docs. Therefore, new shared, AI-powered knowledge hubs will become common.
New Ways to Co-Create and Share Knowledge
Firstly, Chat is not just for people anymore. Platforms will embed AI agents directly into chat channels. Users will be able to co-create, summarize, and automate tasks right inside Google Chat. This connects communication and automation perfectly.
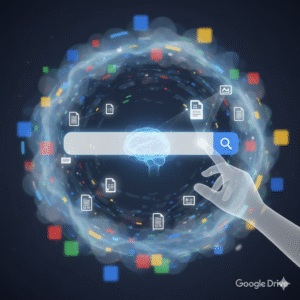
Secondly, new generative AI workspaces are changing collaboration. Tools like Google’s NotebookLM are becoming shared, persistent knowledge hubs. Teams can upload their content. Then, they can ask the AI questions about it. They can also co-analyze the data. This means generating new insights from shared files is much easier. Furthermore, Google is already adding features like image generation and editing directly to Slides and other apps.
Furthermore, Smart Canvas continues to grow. This collaboration experience will connect more third-party apps. Simple @-mentions bring in the right people and data to create intelligent workflows. Truly, these changes ensure teams work in living systems where data, context, and experience converge.
Pillar 3: Meetings Become Smarter and More Accessible
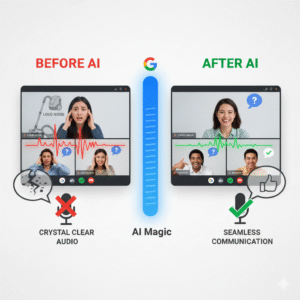
Google Meet is focusing on making hybrid work fair and efficient for everyone. Consequently, AI will take on more responsibility for managing the meeting itself. Clearly, the goal is to ensure every voice is heard and every moment is captured. Therefore, new features will focus on making meetings more inclusive and effective.
AI Manages the Meeting, Humans Focus on Discussion
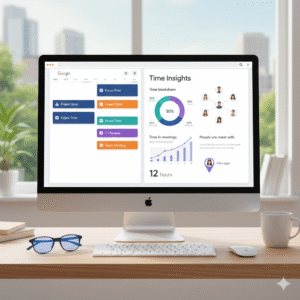
Firstly, AI will continue to take on note-taking. Users can now choose to generate meeting notes that are twice as long as the standard document. This helps capture all the important details. Secondly, AI works on the audio and video quality. Features like Studio Sound and Studio Look ensure quality, even with bad connections or dim lighting.
Furthermore, Calendar automation will increase. Google Calendar will become an automation hub. Workflows will start from a Calendar event. They can automatically add team members, ensure the AI is taking notes, and send follow-up questionnaires. Lastly, video content stored in Drive will become more accessible. New features make video easier to understand for users who are deaf or hard of hearing. They also help those in noisy places or those who speak a different language. Truly, AI is taking over the logistics of the meeting. This lets humans focus on discussion and decision-making.
Pillar 4: Data Integration and Automated IT
The foundation of Google Workspace will also see a major upgrade. This focuses on making data easier to use and automating IT management. Clearly, the goal is to move from IT fixing problems to IT predicting them. Therefore, IT success will be measured by the digital employee experience (DEX).
Smarter Data and Self-Healing Systems
Firstly, data integration will become seamless. Users can already import massive datasets directly to BigQuery from Google Sheets. This makes analyzing huge data sets easier than ever. BigQuery is a data warehouse tool. This means the line between data analysis and simple document creation will vanish.
Secondly, IT will become more proactive. The goal is Autonomous Endpoint Management (AEM). AI will predict device issues before they disrupt work. This automates patching and configuration fixing. Consequently, IT teams can spend less time fixing problems. They can spend more time on strategic work. Furthermore, governance will be key. IT must manage the creation and risk of AI agents like any other digital tool. Truly, the focus shifts to treating the digital workplace as a living system.
Preparing for the 2026 Workspace: The Leader’s Playbook
The roadmap for 2026 is clear: AI integration will be deep and widespread. Therefore, leaders must take specific actions now to prepare their teams. Clearly, success will hinge on three main principles. Truly, organizations must be ready to redesign their digital workplace.
Three Principles for AI Success
Firstly, AI must be grounded in enterprise data. Do not rely on general AI. Instead, use AI that is trained on your specific company’s information. This ensures the agents are accurate and relevant. Secondly, governance must scale with autonomy. As AI agents become more independent, the rules and guardrails overseeing them must become stronger. You must manage agent risk just like any application.
Furthermore, experience is the ultimate KPI. IT success will be measured by how well employees can use the new digital tools. It is about the digital employee experience (DEX). Also, training is critical. Employees need to be ready to work with AI, not just use it. They must know how to use tools like Gemini in Docs and Gmail. Lastly, embrace video and technical health. AI needs perfectly structured content to understand and use it. Truly, by focusing on these principles, leaders can ensure their teams successfully navigate the AI-powered future of Google Workspace.
Frequently Asked Questions (FAQs)
Q1: Is the new AI coming to Google Workspace free?
Yes, Google has decided to include the best of their AI features in standard Workspace Business and Enterprise plans. This means many generative AI features are now available without needing to buy an extra add-on.
Q2: What is an “AI agent” and how is it different from a simple co-pilot?
An AI co-pilot helps you with tasks, like writing an email. An AI agent is more independent. It is a targeted, role-based AI entity which is grounded in your company’s data and trained for specific business tasks. It can manage entire workflows, not just parts of one.
Q3: How will I access the new AI features in Docs and Gmail?
The AI features, called Gemini, are accessed directly within the flow of your work. You will find Gemini in the side panel of Gmail, Docs, Sheets, and Drive. You can quickly draft emails or documents using the “Help me write” feature.
Q4: What is the biggest risk for companies in the 2026 AI environment?
The biggest risk is underinvesting in AI and cloud infrastructure. There is intense competition, and underinvestment can lead to companies falling behind. Another major risk is poor governance of the new AI agents.
Q5: Will I still be able to collaborate in Google Docs and Sheets the old way?
Yes, real-time editing and co-creation remain core features. However, collaboration will be enhanced by Smart Canvas and new knowledge hubs. These hubs allow teams to co-analyze content and generate new insights together.